
A/B test statistical significance: How to interpret your results
Statistical significance helps e-commerce and SaaS teams avoid false positives, run traffic more efficiently, and connect hard data directly to real business decisions.






Updated August 4, 2026

Every online store or SaaS company loses revenue to poor data visibility, bad assumptions, and premature declarations of victory. You launch an experiment, watch the variant's conversion rate spike by 20%, stop the test on day three, and roll out a change that ultimately flatlines your actual revenue.
Statistical significance helps you tell the difference between a real result and one that's just due to chance. To use it correctly, you need to look beyond the percentages and consider factors like risk, sample size, and the underlying statistics.
Key takeaways
- Statistical significance helps determine whether A/B test results are genuine or simply due to random chance.
- Don't declare a winner too early. Wait until your test has collected enough data and reached predefined confidence thresholds.
- Evaluate more than statistical significance by considering sample size, test duration, data quality, and business impact before deploying a variation.
- Treat statistical significance as the starting point for decision-making, not the final answer.
What is statistical significance?
Statistical significance helps figure out whether the difference in conversion rates between your control and variation groups actually comes from your conversion rate optimization efforts instead of just random luck.
However, statistical significance has limits. It doesn't guarantee long-term business impact, explain why users behaved differently, or mean the same level of improvement will continue as you scale. It also can't protect you from false positives if you analyze results before collecting enough data.
The statistics that determine whether your test results are trustworthy
Before looking at a single dashboard metric, you need to understand the core vocabulary that dictates experiment validity. Rather than relying on guesswork, modern testing relies on structured frameworks and probability rules.
- Hypothesis testing: The foundation of every A/B test. You begin by assuming there is no difference between the control and variation (the null hypothesis) and only reject that assumption if the data provides sufficient evidence.
- p-value : The probability of observing your test results if the null hypothesis is actually true. For example, a p-value of 0.03 means there is a 3% chance that the observed difference occurred purely by random chance.
- Confidence levels: The threshold for determining whether a result is statistically significant, typically set at 90% or 95%. A 95% confidence level means you accept a 5% risk of incorrectly declaring a winner when no real difference exists.
- Confidence intervals: The range within which the true effect of your variation is likely to fall. Rather than treating a result like a 15% conversion lift as exact, a confidence interval (for example, +2% to +28%) reflects the uncertainty around that estimate.
- Statistical power: Research published in PubMed Central identifies 80% statistical power as the conventional minimum for many studies. Experiments with lower statistical power are more likely to miss genuine improvements, increasing the risk of false negatives.
» Want your A/B testing fully managed by experts? See how the CROforce platform works
How to calculate statistical significance and choose confidence levels
Calculating statistical significance starts by comparing the conversion rates of your control and variation. You then factor in the number of visitors and conversions each version received.
At that point, an A/B testing significance calculator or experimentation platform calculates a p-value to determine whether the observed difference is likely due to your changes or simply random chance.
Example
Imagine you're testing two versions of a landing page:
Metric | Control | Variation |
|---|---|---|
Visitors | 10,000 | 10, 000 |
Conversions | 500 | 560 |
Conversion rate | 5.0% | 5.6% |
1. Calculate the conversion rates
- Control: 500 ÷ 10,000 = 5.0%
- Variation: 560 ÷ 10,000 = 5.6%
2. Calculate the uplift
Uplift = ((Variation CR - Control CR) ÷ Control CR) × 100
Calculation = ((5.6% - 5.0%) ÷ 5.0%) × 100
= 12%
At first glance, the variation appears to increase conversions by 12%.
3. Determine statistical significance
Once the experiment has run for the planned duration and collected enough data, enter the conversion rates, visitor counts, and conversion totals into an A/B testing significance calculator or experimentation platform.
In this example, the calculator returns a p-value of 0.059.
4. Convert the p-value into a confidence level
Most A/B testing platforms display the result as a confidence level, which is calculated as:
Confidence level = (1 − p-value) × 100
Calculation: (1−0.059)×100=94.1%
Because the confidence level is below the commonly accepted 95% threshold, the result is not statistically significant. Although the variation looks promising, there isn't enough evidence to conclude that it genuinely outperformed the control, so the test should continue until more data is collected.
Choosing the right confidence level comes down to weighing the business cost of a false positive against the cost of moving too slowly:
- 90% confidence level: Ideal for low-risk, high-velocity iterations where a false positive only incurs minor changes, or for early-stage exploratory tests.
- 95% confidence level: The industry standard for most e-commerce and SaaS optimizations, providing a robust barrier against false positives without requiring infinite traffic.
- 99% confidence level: Reserved for high-stakes overhauls such as core pricing page rewrites or site-wide checkout logic changes where a false positive would severely damage main revenue streams.
Variables that drive statistical significance
- Sample size: Higher traffic volume reduces standard error and narrows confidence intervals. Without adequate volume, data remains too noisy to interpret accurately.
- Baseline conversion rate: Pages with higher baseline rates (such as a cart page converting at 20%) require fewer total visitors to detect absolute percentage changes than low-traffic, low-baseline pages.
- Effect size: Massive structural changes create large effect sizes that reach significance rapidly, whereas micro-tweaks demand much larger traffic samples.
- Traffic allocation split: Equal 50/50 splits maximize statistical power for standard two-way tests, whereas heavily skewed splits drastically extend the time required for a definitive result.
Benefits of proper statistical design
- Elimination of false positives: Stops teams from rolling out phantom winners that degrade revenue over a quarterly horizon.
- Increased efficiency: Prevents wasted engineering and design sprints by ensuring traffic budgets are dedicated only to tests with viable statistical power.
- Predictable revenue growth: Compounds fractional, verified gains across the funnel into reliable month-over-month financial returns.
- Stakeholder trust: Replaces gut-feeling marketing arguments with mathematically defensible proof, aligning product, growth, and executive teams.
- Accurate LTV forecasting: Ensures customer acquisition models rely on true conversion lifts rather than temporary novelty spikes.
» Statistical significance is only valuable if you're testing the right ideas. Talk to a CROforce expert about where to start
Best practices for achieving reliable statistical significance
Run experiments for at least one full business cycle
Test duration is just as important as sample size. Even if an experiment receives thousands of visitors in a single day, the results may be biased by temporary events such as weekends, holidays, promotions, or seasonal shopping patterns.
As a best practice, run experiments for at least two weeks to capture normal variations in user behavior across different days of the week. High-traffic websites can minimize business risk by exposing only a small percentage of visitors to the experiment while still collecting statistically representative data.
Collect enough conversions before making a decision
Statistical significance depends on conversions, not just visitors. A common rule of thumb is to collect at least 100 conversions per variation before interpreting results on smaller websites. High-volume websites that generate thousands of conversions daily should aim for substantially larger sample sizes to reduce uncertainty.
Declaring a winner too early dramatically increases the risk of false positives and unreliable conclusions.
Evaluate multiple statistical signals together
No single metric determines whether an experiment is ready to conclude. At CROforce, our experimentation platform uses a Bayesian statistical model to evaluate multiple signals before recommending whether to deploy a variation.
As shown in the example below, the model doesn't rely on statistical significance alone. Before recommending "Deploy it!", it verifies that the experiment has reached 95% confidence, run for enough time, attracted enough visitors, and collected reliable data.
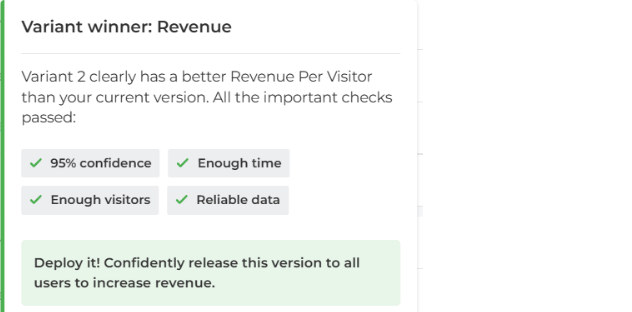
By evaluating these signals together, the model helps ensure that deployment decisions are based on robust statistical evidence rather than a single metric or short-term fluctuations.
Monitor early trends without acting on them
Even before an experiment meets all deployment criteria, early results can provide useful directional insight.
For example, if a variation has recorded only 50 conversions but is outperforming the control by 70%, it may already be a likely winner. Such a large performance gap is unlikely to disappear completely as more data is collected.
However, these early signals should inform monitoring, not deployment decisions. Continue running the experiment until it reaches the predefined thresholds for confidence, sample size, and test duration before implementing any changes.
Define success metrics before launching the experiment
Every experiment should have a clearly defined primary conversion goal before traffic is allocated. Whether the objective is purchases, lead submissions, subscription sign-ups, or another KPI, success criteria should be established in advance to prevent teams from selecting whichever metric appears most favorable after the experiment begins.
Predefining the primary metric reduces bias and ensures decisions remain statistically valid.
Use proxy metrics when primary conversions are too rare
Low-volume businesses often cannot reach statistical significance using their final conversion event alone. For example, a B2B company generating only 10 demo requests per month or a single enterprise sale worth $10,000 may need months to complete one experiment.
Instead, teams should optimize meaningful proxy metrics, such as progression from the homepage to the pricing page, visits to the demo page, or clicks on the "Book a Demo" button. These higher-volume events provide enough data to evaluate changes while still reflecting genuine purchase intent.
Ensure data quality before trusting the results
Statistical significance is only as reliable as the underlying data. Before analyzing an experiment, verify that tracking scripts fire consistently, conversion events are recorded accurately, traffic is allocated correctly between variations, and bots or duplicate events have not distorted the dataset. Reliable instrumentation is a prerequisite for reliable statistical conclusions.
Avoid stopping experiments because of temporary positive results
One of the most common experimentation mistakes is ending a test as soon as the dashboard shows a statistically significant improvement. Conversion rates often fluctuate from green to red and back again as additional data accumulates, particularly when conversion counts are low.
Teams should follow predefined stopping rules based on minimum test duration, conversion volume, and confidence thresholds rather than reacting to short-term performance swings. This disciplined approach significantly reduces the likelihood of implementing changes based on random variation rather than genuine improvements.
» See the most common A/B testing mistakes
When a statistically significant winner should not be implemented
In most cases, you should implement a statistically significant winning variation. It has shown a genuine improvement and gives you enough evidence to make a confident decision.
However, there are a few situations where it's worth taking a second look to make sure the result doesn't create unintended trade-offs or conflict with broader business goals.
- Brand alignment: Ensure the variation follows brand guidelines and supports the desired customer experience. For example, CROForce observed a statistically significant winning design that was ultimately rejected because it conflicted with the company's branding strategy.
- Business impact: Confirm the improvement extends beyond the primary KPI by reviewing metrics such as revenue, AOV, retention, and customer satisfaction.
- Technical feasibility: Assess whether the expected business value justifies the development effort and implementation cost.
- Segment performance: Verify that the variation performs consistently across key audiences, such as mobile versus desktop users or new versus returning visitors.
Treat statistical significance as the starting point, not the final decision. The strongest experiments combine statistical evidence with sound business judgment. Tom Amitay , CEO at CROforce
» See how CROforce builds experimentation programs that turn statistically significant results into confident business decisions
Use statistical significance to make confident decisions
Statistical significance proves your results are real, but a green dashboard isn't a final green light. The most successful teams look past raw confidence thresholds to weigh brand alignment, technical feasibility, and long-term customer impact before rolling out a winning variation.
If you want to drive real growth without burning hours on experiment setup, statistics, and analysis, CROforce manages your CRO and A/B testing from end to end. Our specialists design rigorous tests, eliminate false positives, and turn raw data into predictable revenue.
» Book a demo with CROforce to see how managed experimentation can scale your business
FAQs
What does statistical significance prove?
Statistical significance proves that the performance difference between your control and variation groups is very likely the result of your changes rather than pure random chance. It does not guarantee long-term business impact or permanent superiority.
Why shouldn't I stop my A/B test as soon as it hits significance?
Stopping a test early upon seeing a temporary "green" spike drastically increases your risk of false positives. Conversion rates fluctuate due to daily behavioral shifts and random noise, which is why tests must run for at least two full business cycles.
How do I measure success if my website has low traffic?
When primary conversions are too rare to reach statistical significance quickly, you should optimize proxy metrics. Tracking high-frequency upstream actions, such as pricing page visits or demo button clicks, provides the statistical power needed to evaluate changes reliably.
Does statistical significance guarantee higher revenue?
No. Statistical significance shows that a result is unlikely to be due to chance, but it doesn't guarantee a long-term increase in revenue or business performance.
Always review the broader business impact before implementation.
Should I implement every statistically significant winner?
In most cases, yes. A statistically significant winner has demonstrated a real improvement and should be implemented.
However, it's still worth checking for rare exceptions, such as brand conflicts, technical limitations, or unexpected impacts on key business metrics.