
10 A/B testing mistakes that will kill your results
Most A/B tests don't fail because of a bad idea. They fail because of a broken process. Here are the 10 A/B testing mistakes quietly wrecking your results and how to prevent them.






Published July 16, 2026

If you're running A/B tests regularly, you already know the drill: build a variant, split traffic, wait for significance, ship the winner. What most teams don't have is a way to tell whether that process is actually working, so they just run test after test that looks fine on paper but never moves revenue.
This list covers the 10 places where that process usually breaks, from vague hypotheses and early stop points to mismatched A/B testing metrics and broken tracking. Each one includes what it looks like in practice and how to fix it before it costs you.
1. Skipping a real hypothesis
If you don't write down what you're testing, why, and how you'll know it worked, you're not really running a proper split test. You're just changing something and hoping it helps.
A good hypothesis follows a simple format: "If we [change], then [metric] will [improve/decline], because [reason]." That structure forces you to name the metric before the test runs, so you're not left picking whichever number looks best once the results come in.
Define your hypothesis, metric, and funnel fit
- Write the hypothesis first: Use the if/then/because format above. For example: "If we move the free shipping message above the fold, add-to-cart rate will increase, because shoppers currently miss it further down the page."
- Pick one primary metric: Everything else becomes a guardrail or a diagnostic, decided before the test runs, not after.
- Match the metric to the funnel stage: Don't judge a landing page test on lifetime value (LTV) if the test can't run long enough to see it.
A 2025 study on experimentation programs found that mature programs typically split their metrics into three roles: one primary metric the test is meant to move, guardrail metrics to catch unintended harm, and diagnostic metrics to explain the result. Without that structure, a "winning" test can hurt a metric nobody was tracking.
For example: Turum-burum built their hypothesis from evidence, not a guess. An exit-intent survey on Ukrainian footwear retailer Intertop's checkout page found that 48.6% of 444 respondents couldn't complete the checkout form.
That data pointed to a specific, testable hypothesis: reducing form fields, restructuring the layout, and adding autofill would increase checkout completion because the form itself was the blocker.
The test variant saw a 54.68% lift in conversion rate, average revenue per user (ARPU) grew 11.46% after rollout, and checkout bounce rate dropped 13.35%.
2. Stopping the test the moment it looks like a winner
Ending a test the moment it looks like it's winning feels efficient, but it isn't. Early results carry less data behind them, so they're naturally more volatile. A variant showing a 10% lift on day two can easily settle to 2%, or vanish entirely, by day ten, once more visitors have moved through the funnel.
The risk compounds if you're checking results daily and treating every check as a decision point. Each early look is another chance to catch a temporary swing and act on it before the test has had time to stabilize. That's what a pre-set sample size and test duration are for. They tell you when the data is actually ready to be trusted, not just when one variant happens to be ahead.
How to avoid stopping your test too early
- Set your numbers before you launch: Decide your sample size and minimum detectable effect ahead of time.
- Let the test run to that number: No matter what the interim data looks like, don't call it early.
- Use the right method to check progress: If you genuinely need to peek mid-test, use a sequential testing method built for that, like a sequential probability ratio test (SPRT) or a Bayesian approach, rather than a standard significance calculation.
3. Testing too many variables at once
Changing the headline, the hero image, and the button copy in a single variant might seem like a shortcut to faster answers, but it usually costs you the answer altogether. If the test wins, you don't know which change actually did it. If it loses, you might have thrown away a genuinely good idea because it was bundled with a bad one.
If you want to test several changes at once, multivariate testing is the alternative built for that, not a standard A/B test. It runs every combination of your variables against each other, so you can see how much each individual change, and each interaction between them, actually contributed to the result.
The trade-off is traffic. Testing three elements with two versions each creates eight combinations to split visitors across, so you need a meaningfully larger sample than a standard two-way test before you can trust the result. Before choosing between the two, make sure you understand the difference between A/B and multivariate testing.
» Not sure your last test really isolated one variable? Talk to a CRO expert
4. Ignoring sample ratio mismatch and other data quality issues
Sample ratio mismatch (SRM) happens when the traffic split you actually observe doesn't match what you configured, say 55/45 instead of 50/50. It's usually a sign that something upstream is broken.
Microsoft's applied research into diagnosing sample ratio mismatch points to a few common causes, and they can show up at any stage of a test:
- Assignment: Users get bucketed incorrectly into the wrong variant.
- Execution: A redirect leaks users out of one variant partway through.
- Log processing: An error in how the data gets recorded or joined.
Before trusting any result, check that the observed split matches what you set up. A free SRM checker can confirm this in seconds. If the numbers don't line up, diagnose the leak. Don't just reweight the numbers and move on.
5. Skipping QA on tracking and event setup
A test can be perfectly designed and still lie to you if the tracking underneath it is broken. Events firing twice, a redirect that only fires on one variant, or a tag that doesn't load consistently on mobile can all make a losing variant look like a winner, or hide a real win entirely. QA sits inside every stage of A/B testing your website, not just at launch.
QA pass to run before every test goes live:
- Confirm every event fires once: Double-check buttons, forms, and key interactions in both variants.
- Check URLs and redirects match: Broken or inconsistent redirects are one of the most common causes of a skewed sample split.
- Test across devices and browsers: A tag that loads fine on desktop Chrome can silently fail on mobile Safari.
Treat this checklist as non-negotiable. Broken tracking invalidates the test entirely.
6. Confusing statistical significance with business impact
A result can be statistically significant and still not matter. A 0.3% lift in click-through on a low-traffic page might clear a p-value threshold while representing a handful of extra clicks a month, nowhere near enough to
justify the engineering time or the risk of a regression elsewhere.
- Statistical significance answers: "Is this test result real, or just random noise?"
- Practical impact answers: "Is this test result big enough to be worth acting on?
You need both before rolling a change out to everyone. This is exactly where getting A/B testing metrics wrong causes the most damage: a program can look busy, constantly shipping "winners," while contributing nothing to revenue.
A 2024 statistical methodology review published in The American Statistician backs this up. In practice, teams often track hundreds or even thousands of metrics per experiment, most just for debugging, some acting as guardrails, and only a small subset that actually make up the criterion the test was meant to optimize. Treating every metric that moves as equally important is how teams end up chasing noise dressed up as insight.
Romi Hecto , CRO Specialist at CROforce
7. Overlooking mobile, desktop, and other segment differences
A hypothesis that makes sense on desktop can flop on mobile for reasons that have nothing to do with the idea itself, like a button that renders below the fold or a form field that's fiddly to tap.
Testing only the aggregate result, without checking it by device, new versus returning visitor, or traffic source, can hide the fact that your "winner" only won for one segment and quietly lost for another. This is exactly why dedicated mobile A/B tests usually need their own hypothesis rather than assuming a desktop win will translate.
8. Letting novelty effects and seasonality skew results
A new design element often gets a temporary bump just because it's new, not because it's actually better. That novelty effect fades within days or weeks, and a test stopped too early bakes it right into your "result."
Seasonality causes the same problem: a pricing test run entirely during a promo period tells you almost nothing about the rest of the year. Running tests across at least one full business cycle, and comparing week over week rather than day over day, protects you from both.
» See how CROforce runs A/B testing and experimentation with seasonality built into the test calendar
9. Skipping post-test documentation and segment analysis
The learning from a test doesn't end when it hits significance. Without a documented breakdown of why it won, lost, or did nothing, that insight gets lost, and the next test starts from zero instead of building on it. A short, consistent report after every test keeps that insight around so your next hypothesis is based on evidence
What a good post-test report includes
- Hypothesis and result: What you changed, what you expected, and what actually happened.
- Segment breakdown: How the result held up across device, traffic source, and new versus returning visitors.
- Next step: Roll out, iterate, or shelve, and why.
A well-documented win still needs a sanity check before full rollout, too.
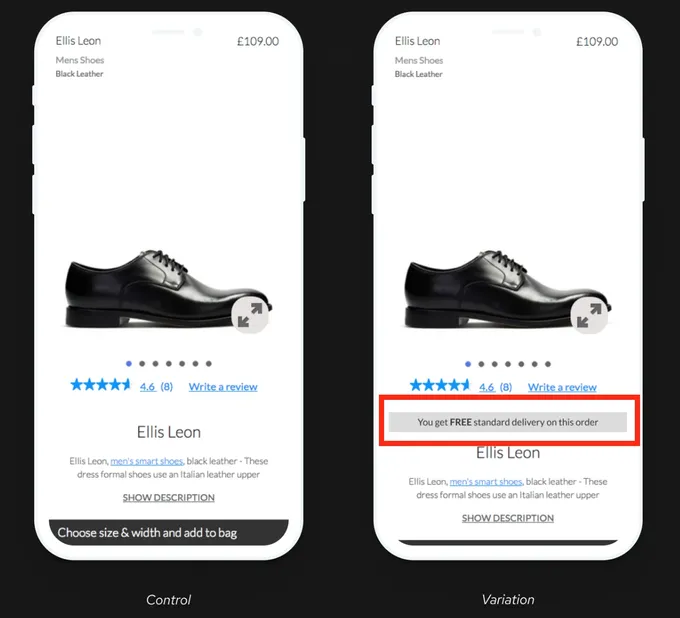
For example: Clarks' free-shipping visibility test shows what that kind of documentation should capture. The finding wasn't just "conversion rate increased by 2.6%, adding roughly £2.8 million in revenue."
It was that making an existing offer more visible drove the result, not the offer itself. The same kind of friction point shows up in checkout optimization. That's what makes the insight reusable elsewhere, instead of a one-off win nobody can build on.
10. Relying on the wrong platform or process for your test volume
Missed sample ratio checks, thin segment analysis, and tests launched without a documented hypothesis aren't really tooling problems, they're process problems. But the wrong platform makes every one of those mistakes harder to catch.
Signs your current setup can't catch these mistakes
- No reliable tracking validation: A purely client-side visual editor can't confirm your tracking is firing correctly or catch a sample ratio issue.
- No segment-level reporting: Without it, a "winning" test can hide a loss for mobile users, new visitors, or another key segment.
- No one checking the statistics: A team without a dedicated statistician can end up trusting a dashboard's significance flag without knowing what's actually behind it.
Before committing to a tool, it's worth carefully comparing A/B testing tools to find which best fits your traffic volume, technical resources, and reporting needs. Picking the wrong category here is one of the most common reasons testing programs stall out.
For teams without the in-house capacity, expertise, or tools to make that call confidently, a managed CRO service is worth considering as an alternative to building the process from scratch. CROforce pairs its platform with a team that handles that evaluation for you, matched to your traffic level and stack.
Build a foolproof testing program
None of the mistakes above are exotic. They're the same handful of process gaps showing up in different disguises: a missing hypothesis, an early peek, a broken tag, a metric that doesn't map to revenue. Catching them consistently starts with having a repeatable process and a platform built to enforce it.
The CROforce A/B testing platform builds these checks in directly. That includes sample ratio validation, segment-level readouts, and built-in heatmaps to see exactly where a variant is winning or losing attention.
» Ready to stop losing revenue to preventable mistakes? Book a demo with CROforce
FAQs
What's the most common a/b testing mistake?
Ending a test the moment it hits statistical significance, often called peeking. It inflates the odds of mistaking random noise for a real, repeatable effect.
What a/b testing metrics should I actually track?
One primary metric tied directly to the business outcome you care about (revenue per visitor, not clicks), plus a small set of guardrail metrics to catch any hidden downside, like page load time or return rate.
How long should an A/B test run?
Long enough to hit your pre-calculated sample size, and ideally across at least one full business cycle, so day-of-week patterns, novelty effects, and short-term seasonality don't skew the result.
Can small teams avoid these mistakes without a data science background?
Yes. A written hypothesis, one primary metric decided in advance, a pre-calculated sample size, and a basic sample ratio check cover most of the mistakes above, and none of them require statistical expertise to apply consistently.